

Full Compensation Report
PDF · 88 pages
The complete 2026 study — every table, chart, and benchmark across all 14 roles.
The largest and most comprehensive compensation study ever conducted for the North American missions sector.
Stop guessing. Start benchmarking.

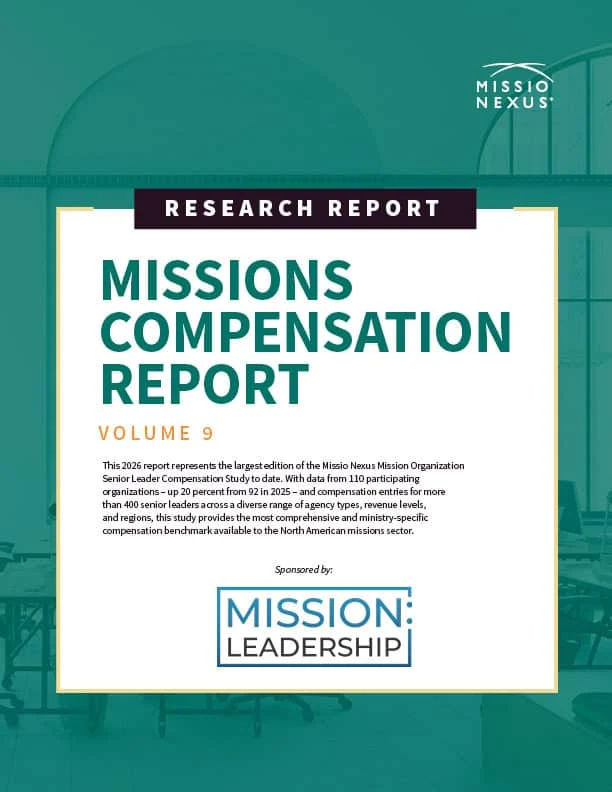
The largest edition of the Missio Nexus Mission Organization Senior Leader Compensation Study to date: 110 participating organizations, up 20 percent from 92 in 2025, and compensation entries for more than 400 senior leaders across a range of agency types, revenue levels and regions.
Median salaries by agency type, revenue band and region, through to retirement contributions, housing allowances and spousal involvement — the ministry-specific benchmark that denominational averages and last year’s number cannot give you.
The headline numbers, drawn from 110 participating organizations across the missions sector.
Everything included with the report.
PDF · 88 pages
The complete 2026 study — every table, chart, and benchmark across all 14 roles.
PDF · 6 pages
The headline findings and key takeaways, formatted for board and leadership review.
PDF · White paper
Median pay, full packages, tenure patterns, and percentile distributions for chief executives.
PDF · White paper
New for 2026 — female CEO compensation and gender representation across leadership teams.
PDF · White paper
Housing allowances, retirement, SECA reimbursement, support-raising, and hybrid funding.
PDF · 4 pages
How the study was conducted, definitions, and the full participant roster.
Slides · PowerPoint
Ready-to-present slides of key charts and stats for your board or leadership meeting.
Audio · MP3
A narrated walkthrough of the report’s biggest findings — listen on the go.
Graphic · High-res image
The at-a-glance visual summary — perfect for sharing internally or on social.
All nine resources
Organizations that took part in the study receive the full report at no cost.
Get your free copyThe member rate, for member organizations that did not take part in the study.
Buy for $200Connecting people. Building trust.
Mission:Leadership is a faith-based executive recruiting firm focused squarely on serving nonprofit ministries, Kingdom-oriented businesses, churches and academic institutions. Whatever your need, we know great Christian leaders throughout the U.S. and across the globe and how to connect you to them.